Past, Present and Future of Akua's Internal Platform
Today I want to tell you a bit about the past, the present and the future we have in mind for the IDP at Akua.
To kick things off, I’m going to borrow a line I heard in the movie Kung Fu Panda
“Yesterday is history, tomorrow is a mystery, but today is a gift. That is why it is called the present.”
Why that line? Because, as I said in the post description, a lot has happened since that June of 2024 when my then teammate, duo partner and — I dare say — friend, the crazy German Yepes, and I started designing Akua’s internal developer platform.
In the present, as I write this, I share the team with Cristian Ortega (Cris) and Jeremy Bacher (Jere); in the past, as I mentioned, I was a duo with el chavito, who decided to move on from Akua back in December 2025, and along the way we also had don Guille Pijuan with us, who is still at Akua doing his thing in the CX (Customer Experience) team.
A while ago (almost two years) we told you a bit about the IDP; today I’m here to tell you about one project in particular: Good Bye AWS DMS (Database Migration Service).
Today kicks off a “Platform Blog Post Trilogy”: I get to go first, and soon we’ll have Cris and Jere telling you about different technical challenges we’re proud to share.
Let’s get into it.
Yesterday Is History: AWS DMS
Before we get our hands dirty, a bit of context on how data moves around at Akua: every project has its own Aurora PostgreSQL database, and every tenant has its warehouse, the ODS (Operational Data Store), where the databases of all the projects come together so that whoever needs to query that data does it there and not against the project’s production database.
To move data from one side to the other we used AWS DMS Serverless, which on paper is exactly what you need: it does an initial load and then keeps replicating changes in real time — aka CDC, Change Data Capture. On paper.
In practice DMS failed, and what hurt the most wasn’t that it failed (everything fails sooner or later) but how it failed: silently. Here’s a rundown of what we found the day we sat down and really looked:
- Dead replications and nobody noticed: 8 replications in
failedstate for months; not a peep, nothing. - The “running” that wasn’t running: tables in
Table errorwhile the replication claimed to berunning, i.e. the console told you everything was great while the table hadn’t received a single row in ages. - Duplicates everywhere: a warehouse with rows duplicated between 80 and 100 times. Yes, you read that right, 80 to 100 times 😅.
- And expensive on top of it: around USD 7,400 a month.
And why can it duplicate? DMS stores its “how far did I get” (the checkpoint) in one place and writes the data somewhere else; if something breaks between one and the other, when it comes back it can reapply what it had already written. Hold on to this detail, because it’s exactly what we did differently.
If you remember our mantras from Building from Differences, the first one says that platform operation and maintenance should tend toward zero; with DMS it was exactly the opposite: you had to operate it just to find out it was broken.
So we asked ourselves the uncomfortable question: what if we build it ourselves? Heads up, this is not a decision you take lightly — everything you build, you then have to maintain; but when the tool of the day tells you everything’s fine while underneath it’s on fire, the math starts to add up pretty quickly.
Today Is a Gift: data-replicator
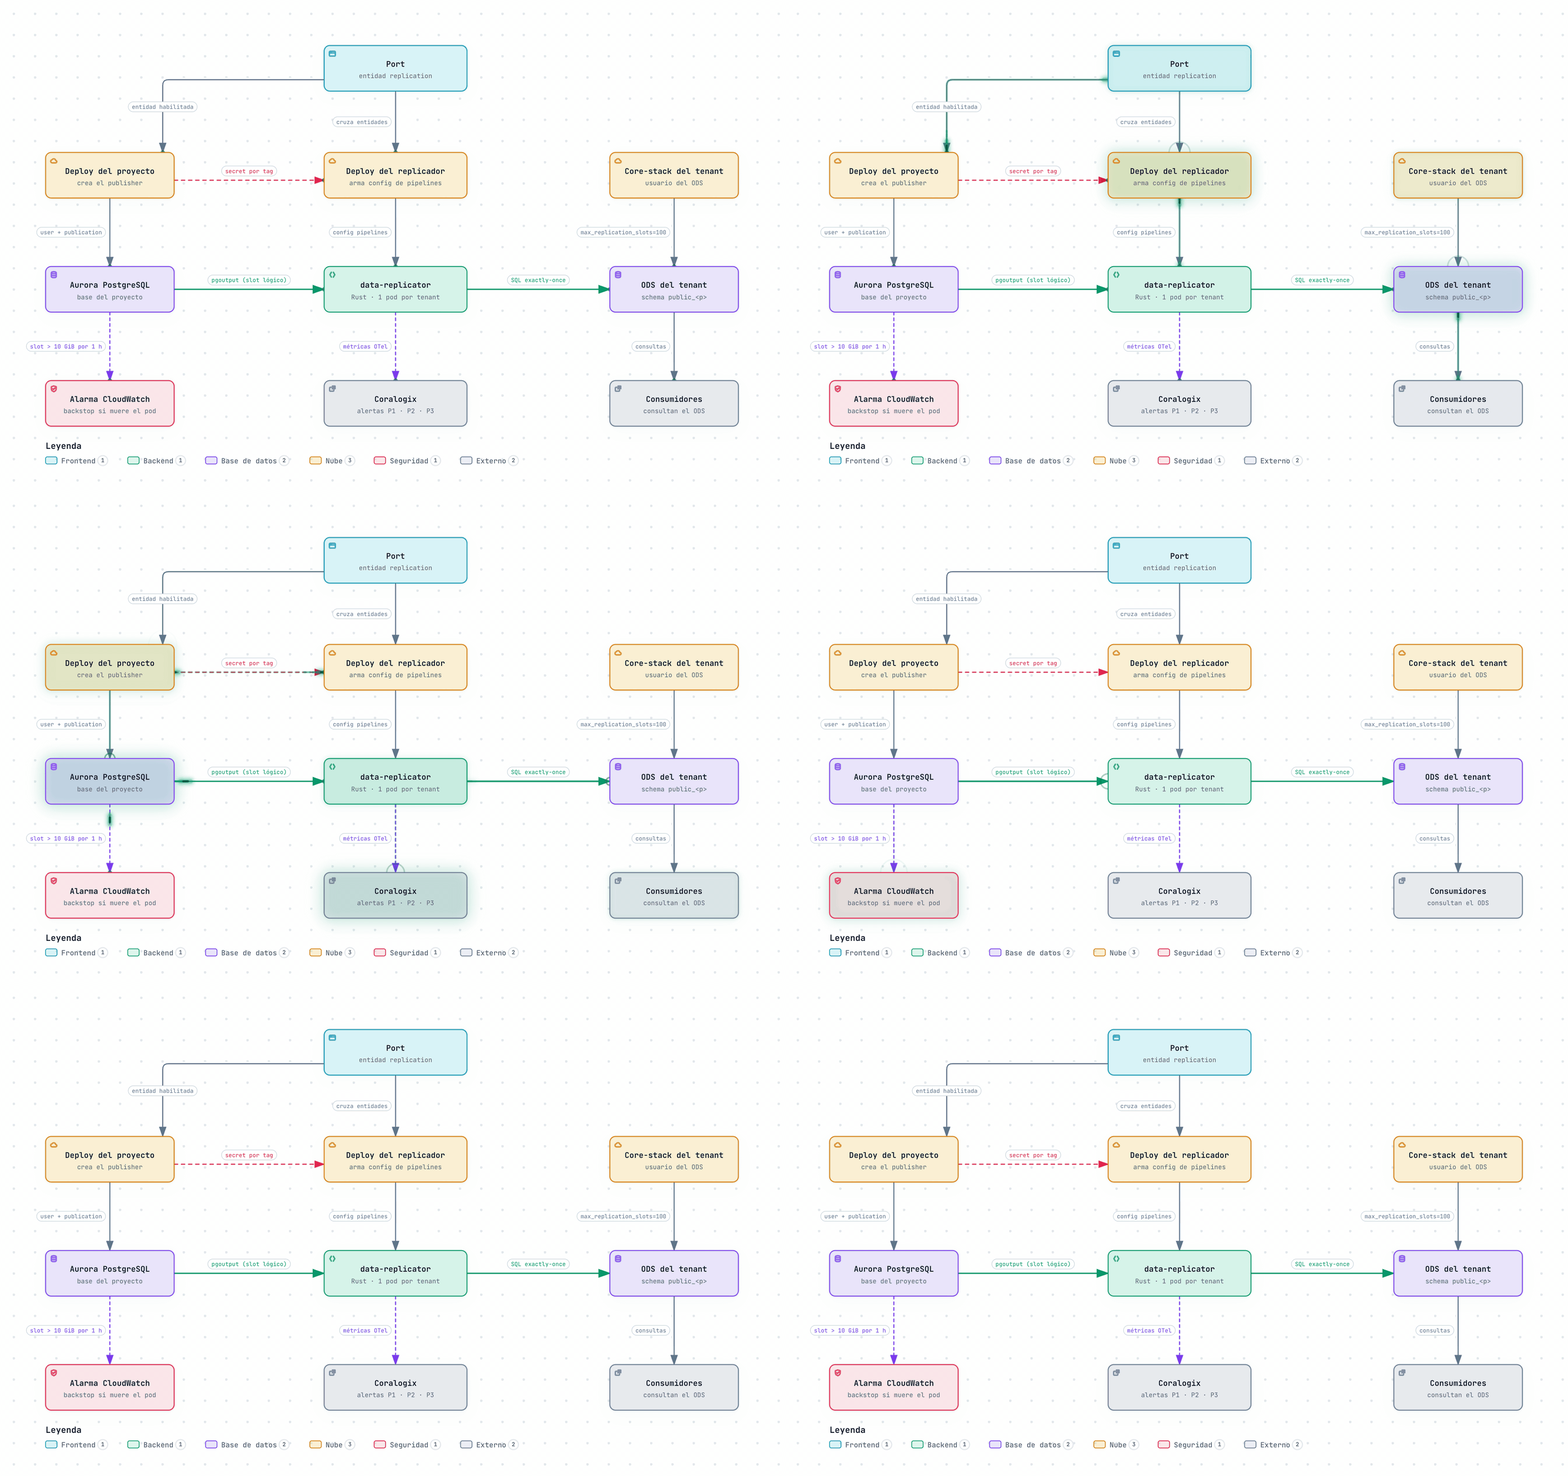
The data-replicator is a process written in Rust — the why of Rust deserves its own post — that copies each project’s Aurora PostgreSQL databases into its tenant’s ODS and keeps them up to date in real time.
Project's Aurora ──pgoutput (logical slot)──▶ data-replicator ──SQL──▶ Tenant's ODS
   publication                                1 pod per tenant         schema public_<p>
   dedicated user                             1 task per pipeline      + origin per pipeline
The architecture is simple on purpose (another one of the mantras: simplicity above all): one pod per tenant on Fargate running all of that tenant’s pipelines, where a pipeline is one source database. That pod costs about USD 72 a month. If one pipeline breaks, the others don’t even notice; each one runs isolated and is supervised separately.
Here’s the full picture; I’ll go over each piece in the sections that follow:
Wait, what’s a slot?
For anyone who has never wrestled with PostgreSQL logical replication, a mini glossary:
- Publication: defines which tables of the database get published; in our case, all of them (
FOR ALL TABLES). - pgoutput: PostgreSQL’s native plugin that reads the WAL and emits transactions as messages (Begin, Insert, Update, Delete, Commit…).
- Slot: a persistent cursor on the source that retains WAL until the consumer confirms it processed it. Careful with this one: if nobody consumes it, the disk grows and grows.
- LSN: the position within the WAL; the “where am I”.
The Life of a Pipeline
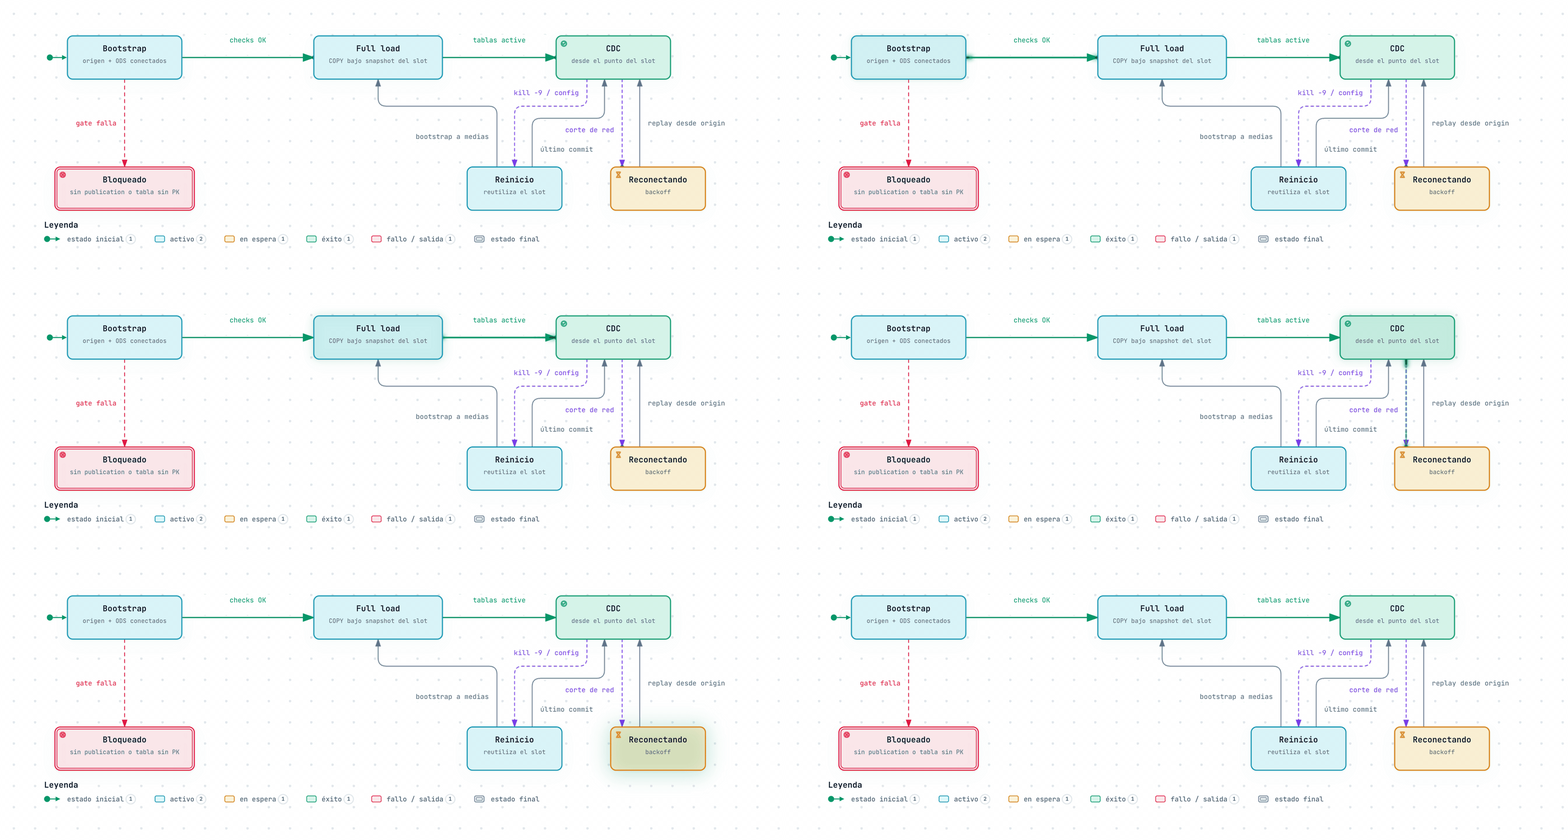
Every pipeline goes through four stages:
- Bootstrap: connects to the source with a dedicated user and to the ODS, checks that the publication exists — the platform creates it during the project’s deploy, not the pod — and that no table is missing a primary key. That last one is not a whim: in PostgreSQL, if you publish a table without a replica identity, the application’s UPDATEs and DELETEs on that table start failing, so the gate is there to protect the project, not the replicator.
- Consistent full load: creates the slot exporting a snapshot and copies every table under that snapshot with
COPY. On the ODS side, theTRUNCATE, the data and the state marker go in a single transaction per table: either the table ends up complete andactive, or nothing is left behind. No half-loaded tables. - CDC: starts exactly from the slot’s consistent point, so between the initial load and the changes there are no gaps and no duplicates. Each source transaction is applied as one transaction in the ODS, with prepared and pipelined statements — sent in batches of 500 without waiting for a response — so a small transaction costs one round-trip instead of six.
- Restart: reuses the existing slot and resumes from the last applied commit. No full load, unless the bootstrap was left halfway.
The full cycle, detours included:
Exactly-Once, or the Guarantee DMS Doesn’t Give You
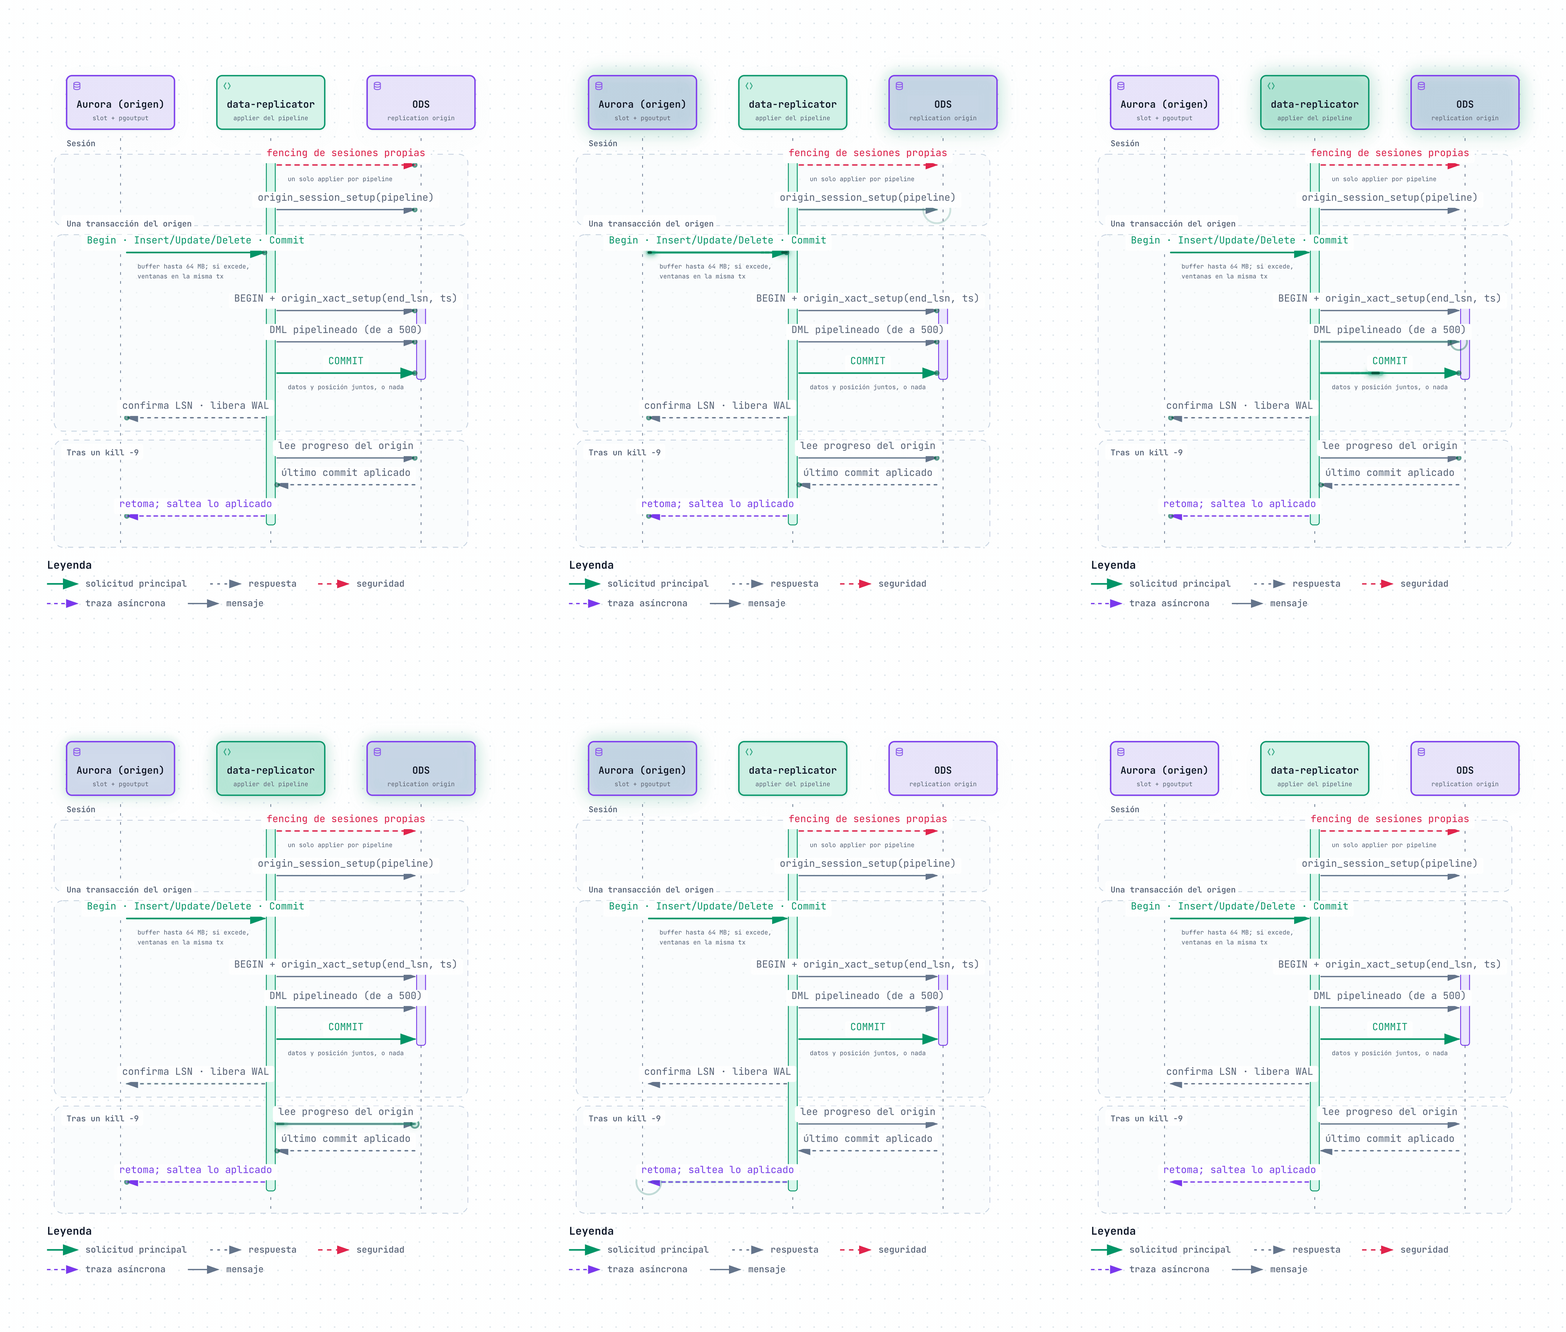
This is the heart of the matter and what makes us puff our chest out. Remember the checkpoint DMS stores separately? We make the data and the position commit together, in the same ODS transaction, using PostgreSQL’s replication origins:
-- simplified: once per session, the applier binds itself to its pipeline's origin
SELECT pg_replication_origin_session_setup('<origin of a pipeline>');

-- for every transaction coming from the source
BEGIN;
SELECT pg_replication_origin_xact_setup('<end_lsn>', '<commit_ts>');
INSERT ...; UPDATE ...; DELETE ...;
COMMIT; -- data and "how far I got", together or not at all
What does this mean in practice? That if you kill -9 the pod in the middle of a transaction, either everything was applied or nothing was; and when it comes back it resumes exactly from the last commit, skipping what was already applied. We validated it by breaking things on purpose in dev, slot rewinds and Aurora failovers included.
Step by step, kill -9 included:
Nothing is free, of course, and this comes with its fine print:
- One replication origin per pipeline in the ODS, which forced us to raise
max_replication_slotsfrom 20 (the default) to 100. It’s a static parameter, i.e. a writer reboot; DMS didn’t need it precisely because it keeps its checkpoint elsewhere. - A single applier per pipeline, always. The Deployment runs with
strategy: Recreate— no rolling update with two pods writing at the same time — and on startup it fences any of its own sessions that were left alive. KEDA and HPA are forbidden on this Deployment, and that’s not a joke.
Fail Loudly and Fail Small
If DMS failed silently and in a big way, here the idea was the opposite: fail loudly and as contained as possible. Some cases:
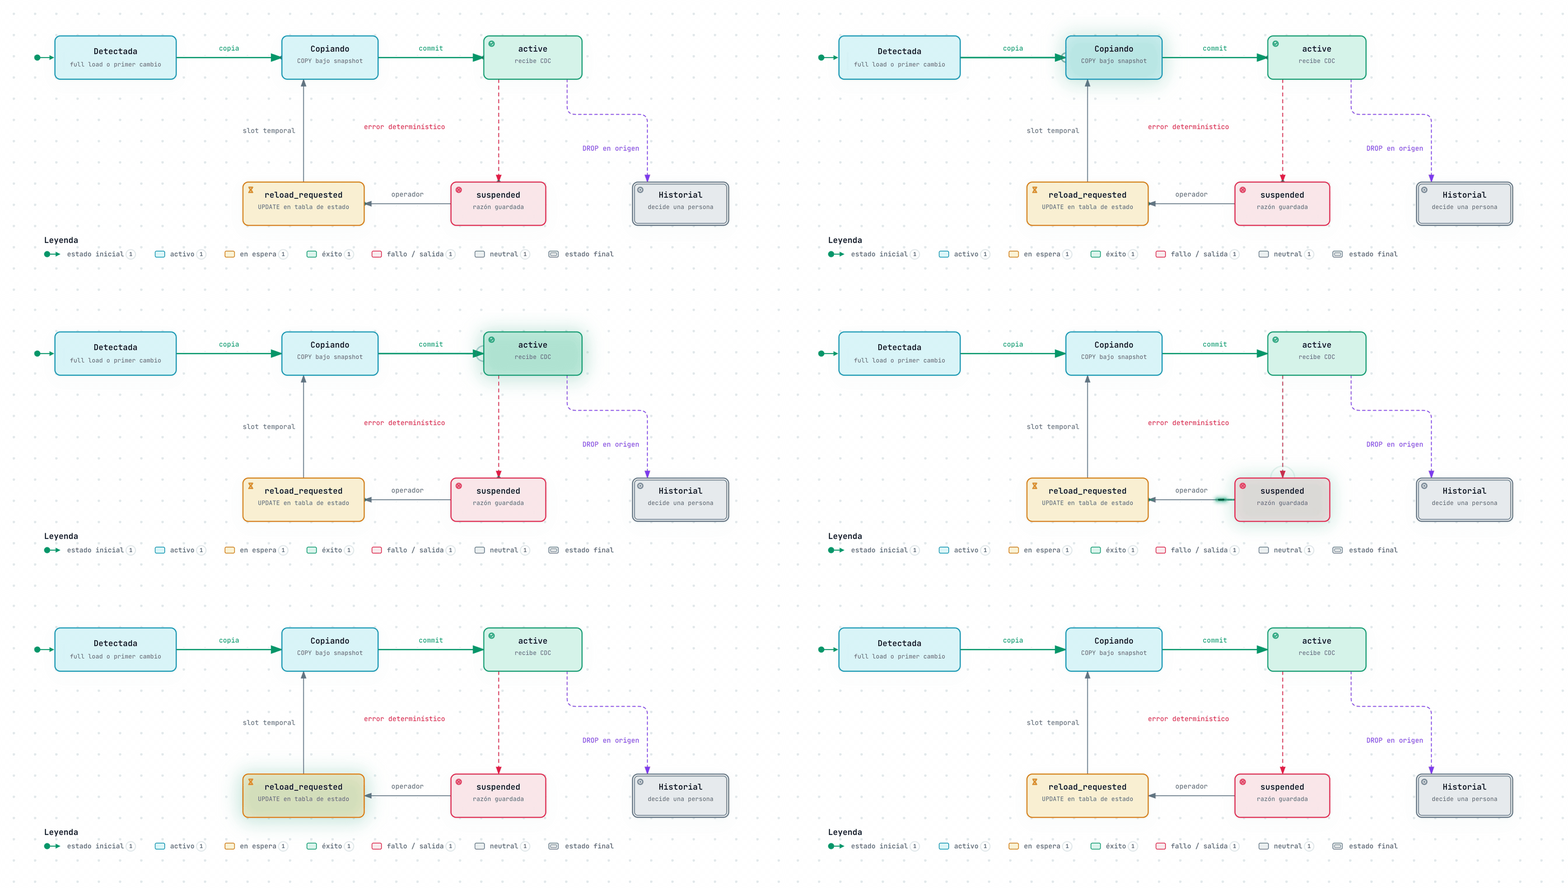
- Deterministic error on a table (a type that doesn’t fit, a constraint, a missing column): only that table gets suspended, the reason is stored and a P1 alert fires; the rest of the pipeline carries on as if nothing happened.
- The source adds a column: the
ADD COLUMNis replicated automatically, and from the data-replicator with the value the source materialized for the old rows, so aDEFAULT 'x'leaves the pre-existing rows identical on both sides. If the default is volatile (clock_timestamp(),nextval()), those rows end up NULL on the target and the replicator lets you know. - New table on the source: it’s detected on its first change and copied on its own.
- The source drops a table: it’s not propagated (DMS did). The copy stays as history and a human decides; deleting data is not something we want to happen on its own.
- A target table with another owner: if another writer created a table with our name — it happened to us with a DMS that a deploy brought back to life — that table gets suspended and we never write over it.
- Giant transactions: they’re buffered up to 64 MB and if they’re bigger they’re applied in windows within the same ODS transaction: memory is bounded by the window, not by the transaction. I confess that up until data-replicator v0.2.11 that was a hard cap, and a transaction exceeding it left the pipeline in a loop; you learn from your mistakes.
- Network cut or ODS restart: reconnection with backoff and replay from the origin. Exactly-once being what it is, there’s nothing to clean up.
And to recover a suspended table? An UPDATE on the replicator’s state table moving it to reload_requested, and it takes care of making a fresh copy through a temporary slot on its own.
Seen from a table’s point of view, the cycle looks like this:
Let Silence Sound the Alarm Too
All the metrics go out through OpenTelemetry to Coralogix with the pipeline as a label: the state of each table, lag in seconds and in bytes of retained WAL, discarded events, reconnections and applied transactions. On top of that we set up three levels of alerts:
- P1: suspended table.
- P2: high lag, silent pipeline or discarded events.
- P3: sustained reconnections or retained WAL.
Notice “silent pipeline”: that’s the alert that would have saved us those months of DMS sitting in failed.
Now, what if the one that dies is the pod? A dead pod can’t tell you it’s dead 😅. For that we have a backstop from the source side: a CloudWatch alarm per cluster that fires if the slot retains more than 10 GiB for an hour; that alarm outlives the pod.
And for the day-to-day, a query that tells us at a glance how a tenant is doing:
-- health of a tenant, in the ODS: not_active has to be 0
SELECT p.pipeline, p.target_schema,
       count(t.table_name) FILTER (WHERE t.state = 'active')  AS active,
       count(t.table_name) FILTER (WHERE t.state <> 'active') AS not_active
FROM _replicator.pipeline_state p
LEFT JOIN _replicator.table_state t USING (pipeline)
GROUP BY 1, 2 ORDER BY 1;
A Toggle in Port and the Rest Discovers Itself
If you read the previous post you know Port is our presentation layer, so this couldn’t be any different. Every project has a replication entity in Port with the bare minimum: whether it’s enabled, which schema it writes to and the odd option here and there, with per-tenant and per-environment overrides for the differences.
From there:
- The project’s deploy: if the entity is enabled and the replicator exists in the tenant, it creates the publisher: the user, the publication, the security group rule from the pod and a secret with the connection. The PK gate I mentioned above lives here.
- The data-replicator’s deploy: discovers those secrets by tag, cross-references them with the Port entities and builds the pipelines’ configuration. An enabled entity without a publisher, or a publisher without an entity, is a warning and it moves on.
- The tenant’s core-stack: creates the user on the ODS side and sets
max_replication_slotsto 100.
“Everything should be self-discoverable — no hardcoding”, ring a bell? 😉
Pausing a pipeline is setting enabled: false. That said, heads up: deleting the entity deletes the publisher and leaves the slot without a consumer, and you already know what happens with a slot without a consumer (yes, the alarm from above).
One rule that saved us more than one headache: the project’s deploy goes after enabling the entity, and you verify it went well by checking that the publisher’s secret exists, not because the pipeline said “done”.
Shadow and Cutover: Swapping the Engine with the Car Running
We didn’t want a big bang. In the tenants where DMS was still alive, each pipeline writes to a parallel schema, shadow_<project>, with the same table names DMS leaves in public. That way they coexist without stepping on each other, we compare parity with real traffic, and consumers can build their indexes on the shadow at their own pace.
End to end, the journey looks like this:
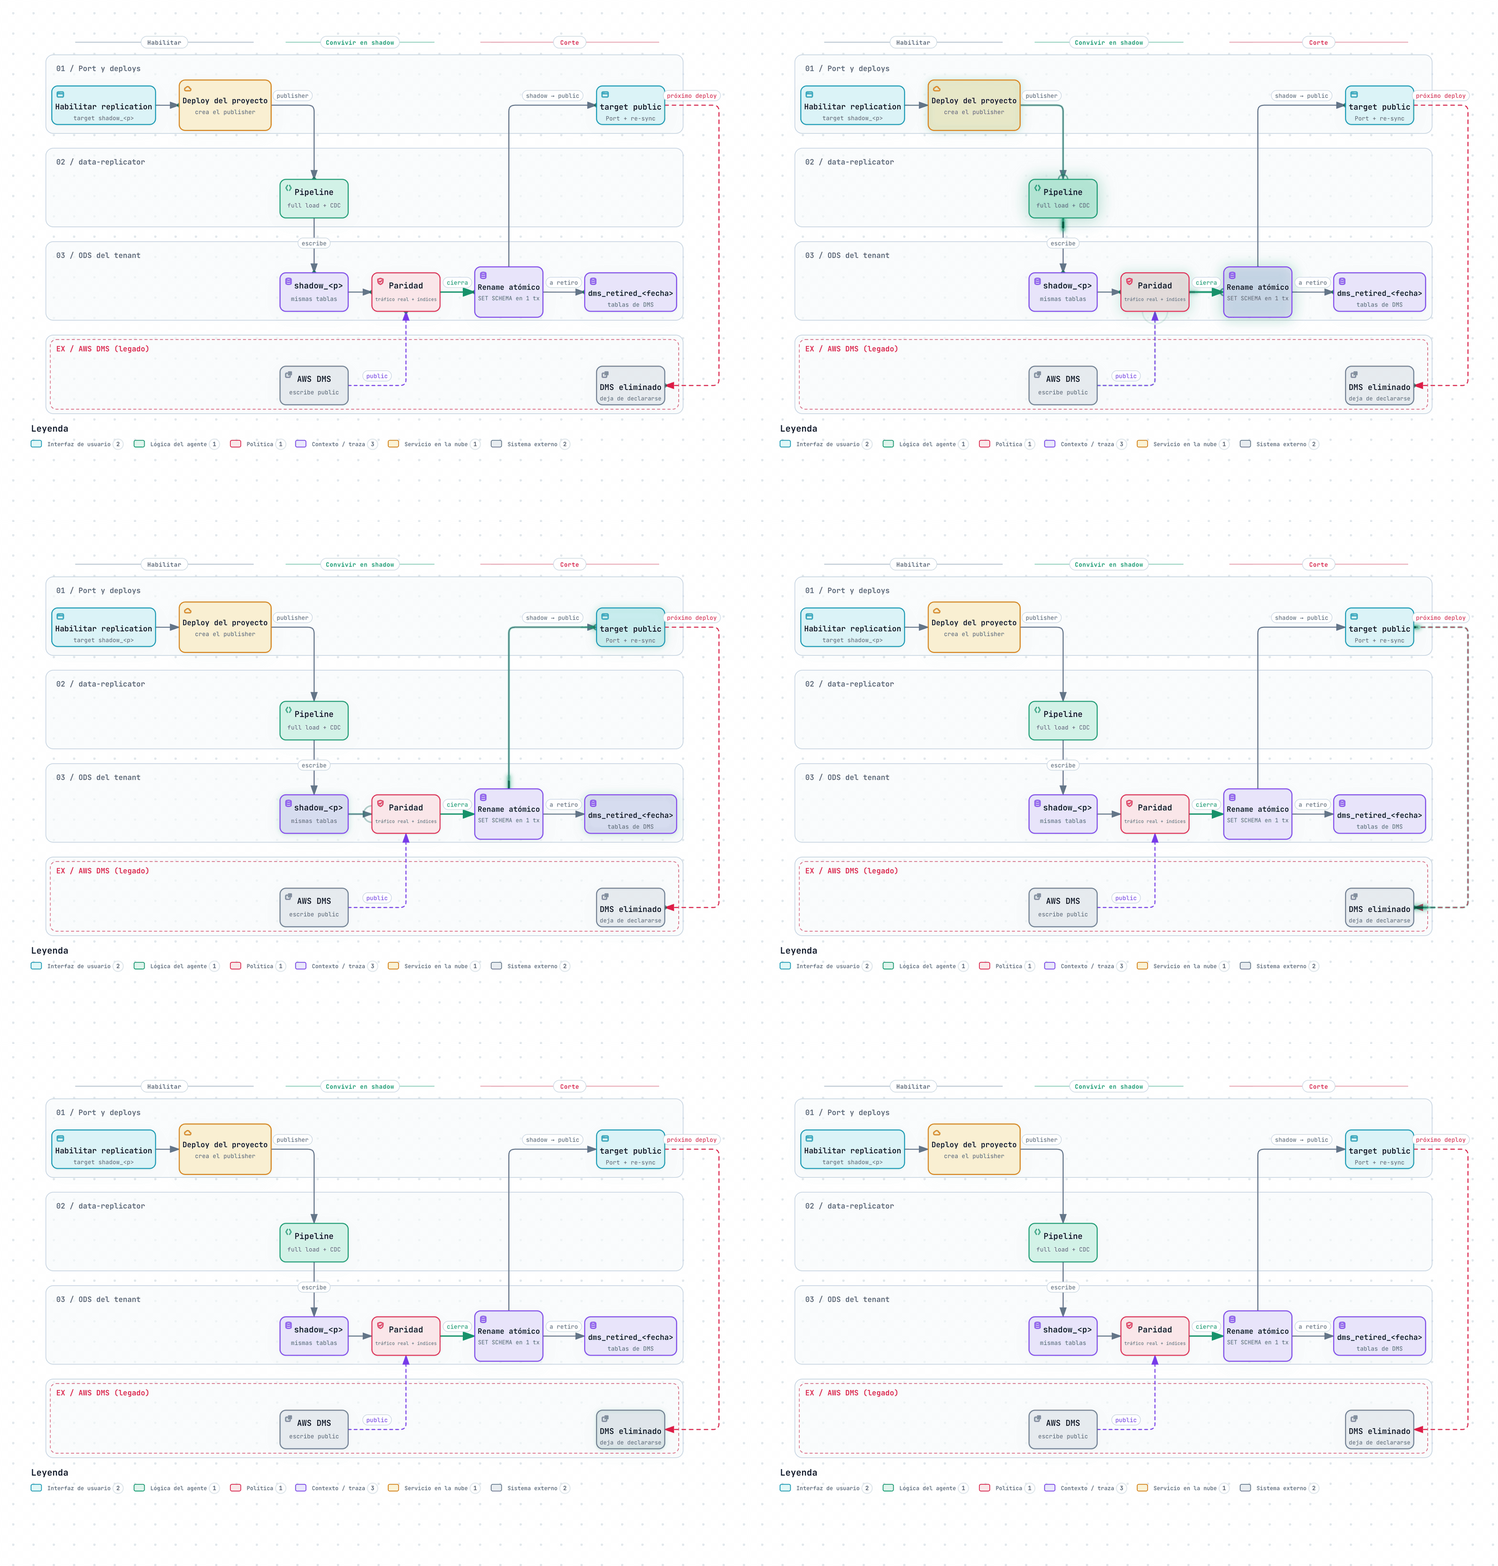
When everything checks out, the cutover is an atomic rename in a single transaction:
-- simplified; the real one lives in our runbook
BEGIN;
CREATE SCHEMA dms_retired_<date>;
ALTER TABLE public.<table>     SET SCHEMA dms_retired_<date>;  -- DMS's tables, off to retirement
ALTER TABLE shadow_<p>.<table> SET SCHEMA public;              -- ours, into production
-- ...for every table, and the pipeline's target_schema gets updated
COMMIT;
SET SCHEMA drags indexes, constraints and permissions along with it, so there’s no full load, the window is a matter of seconds and the rollback is symmetric (the same move in reverse). Afterwards you switch the target schema in Port, re-sync, and the project’s next deploy removes its DMS on its own: if the replication entity is enabled on public, the replicator is the owner and DMS stops being declared.
As I write this (late-October numbers) we have 23 pipelines running in dev and 114 in production, already cut over to public for good.
Tomorrow Is a Mystery
As Master Oogway says, tomorrow is a mystery, but a few things are already on our radar:
- Finish the cutovers, and switch off the last DMS; there will be a celebration that day.
- Hot reload of the configuration: today, changing the config restarts the pod; it’s a clean restart because every pipeline resumes from its origin, but we want to mount the config as a ConfigMap and reload it on the fly.
Conclusions
To wrap up, I want to leave you with a few rules that got tattooed on us along the way:
- The source of truth for the ODS is the ODS, not DMS statistics nor whatever a console says.
- Any count from an AWS API that comes back as exactly 100 is pagination. Sounds like a joke, but it isn’t 😅.
- Failing is fine, failing silently is not. I’d take a suspended table with its reason and a P1 alert over a “running” that doesn’t run, a thousand times over.
- Shadow before big bang: coexist, compare, and only then cut over and switch.
Replacing an AWS managed service with something of your own is dizzying, and it’s fine that it is; but when what you pay for gives you no guarantees and on top of that doesn’t tell you when it breaks, building with clear guarantees — exactly-once, contained and visible failures, a cutover you can revert — is the closest thing to doing things right and sleeping soundly.
This was the first chapter of the trilogy; in the next posts Cris and Jere will tell their side, so stay tuned.
See you next time 👋🏽